
Wizards of analytics rejoice! We recently launched a special report feature to assist our multi-session and longitudinal playtest customers. With this feature, our customers can dig deeper and better understand their playtest results.
What's changed?
With the new longitudinal/multi-session study report, our game studios can view a comprehensive results page of each of the daily survey questions. This equips our game studios with the tools to help analyze each question response by a player - looking at it on both a daily level and on an overall level. This is achieved by a line graph tracking the responses throughout the study along with an accompanying chart to be able to see the details of each response. We also chart out statistics for each answer such as the average ranking, the most common ranking, and the median ranking.
How do I access them?
Access to this feature is easy. The report is available to our customers who have ordered a Longitudinal or Multi-session playtest with survey questions after January 16th, 2020. Once your results have come in just follow these steps to access the page:
- Log into your account and go to the My Playtests page.
- Once there, open a completed multi-session or longitudinal playtest.
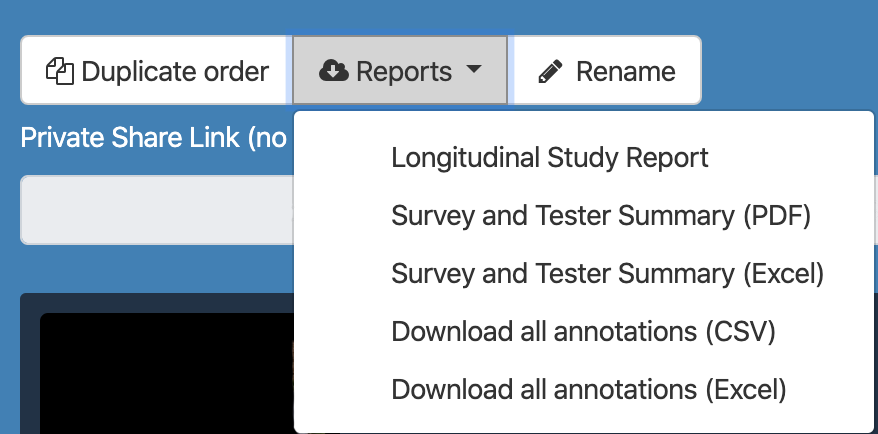
- Then simply click on the Reports drop-down menu and select Multi-session Playtest Report or Longitudinal Study Report.
It’s as easy as that!
What does the results page look like?
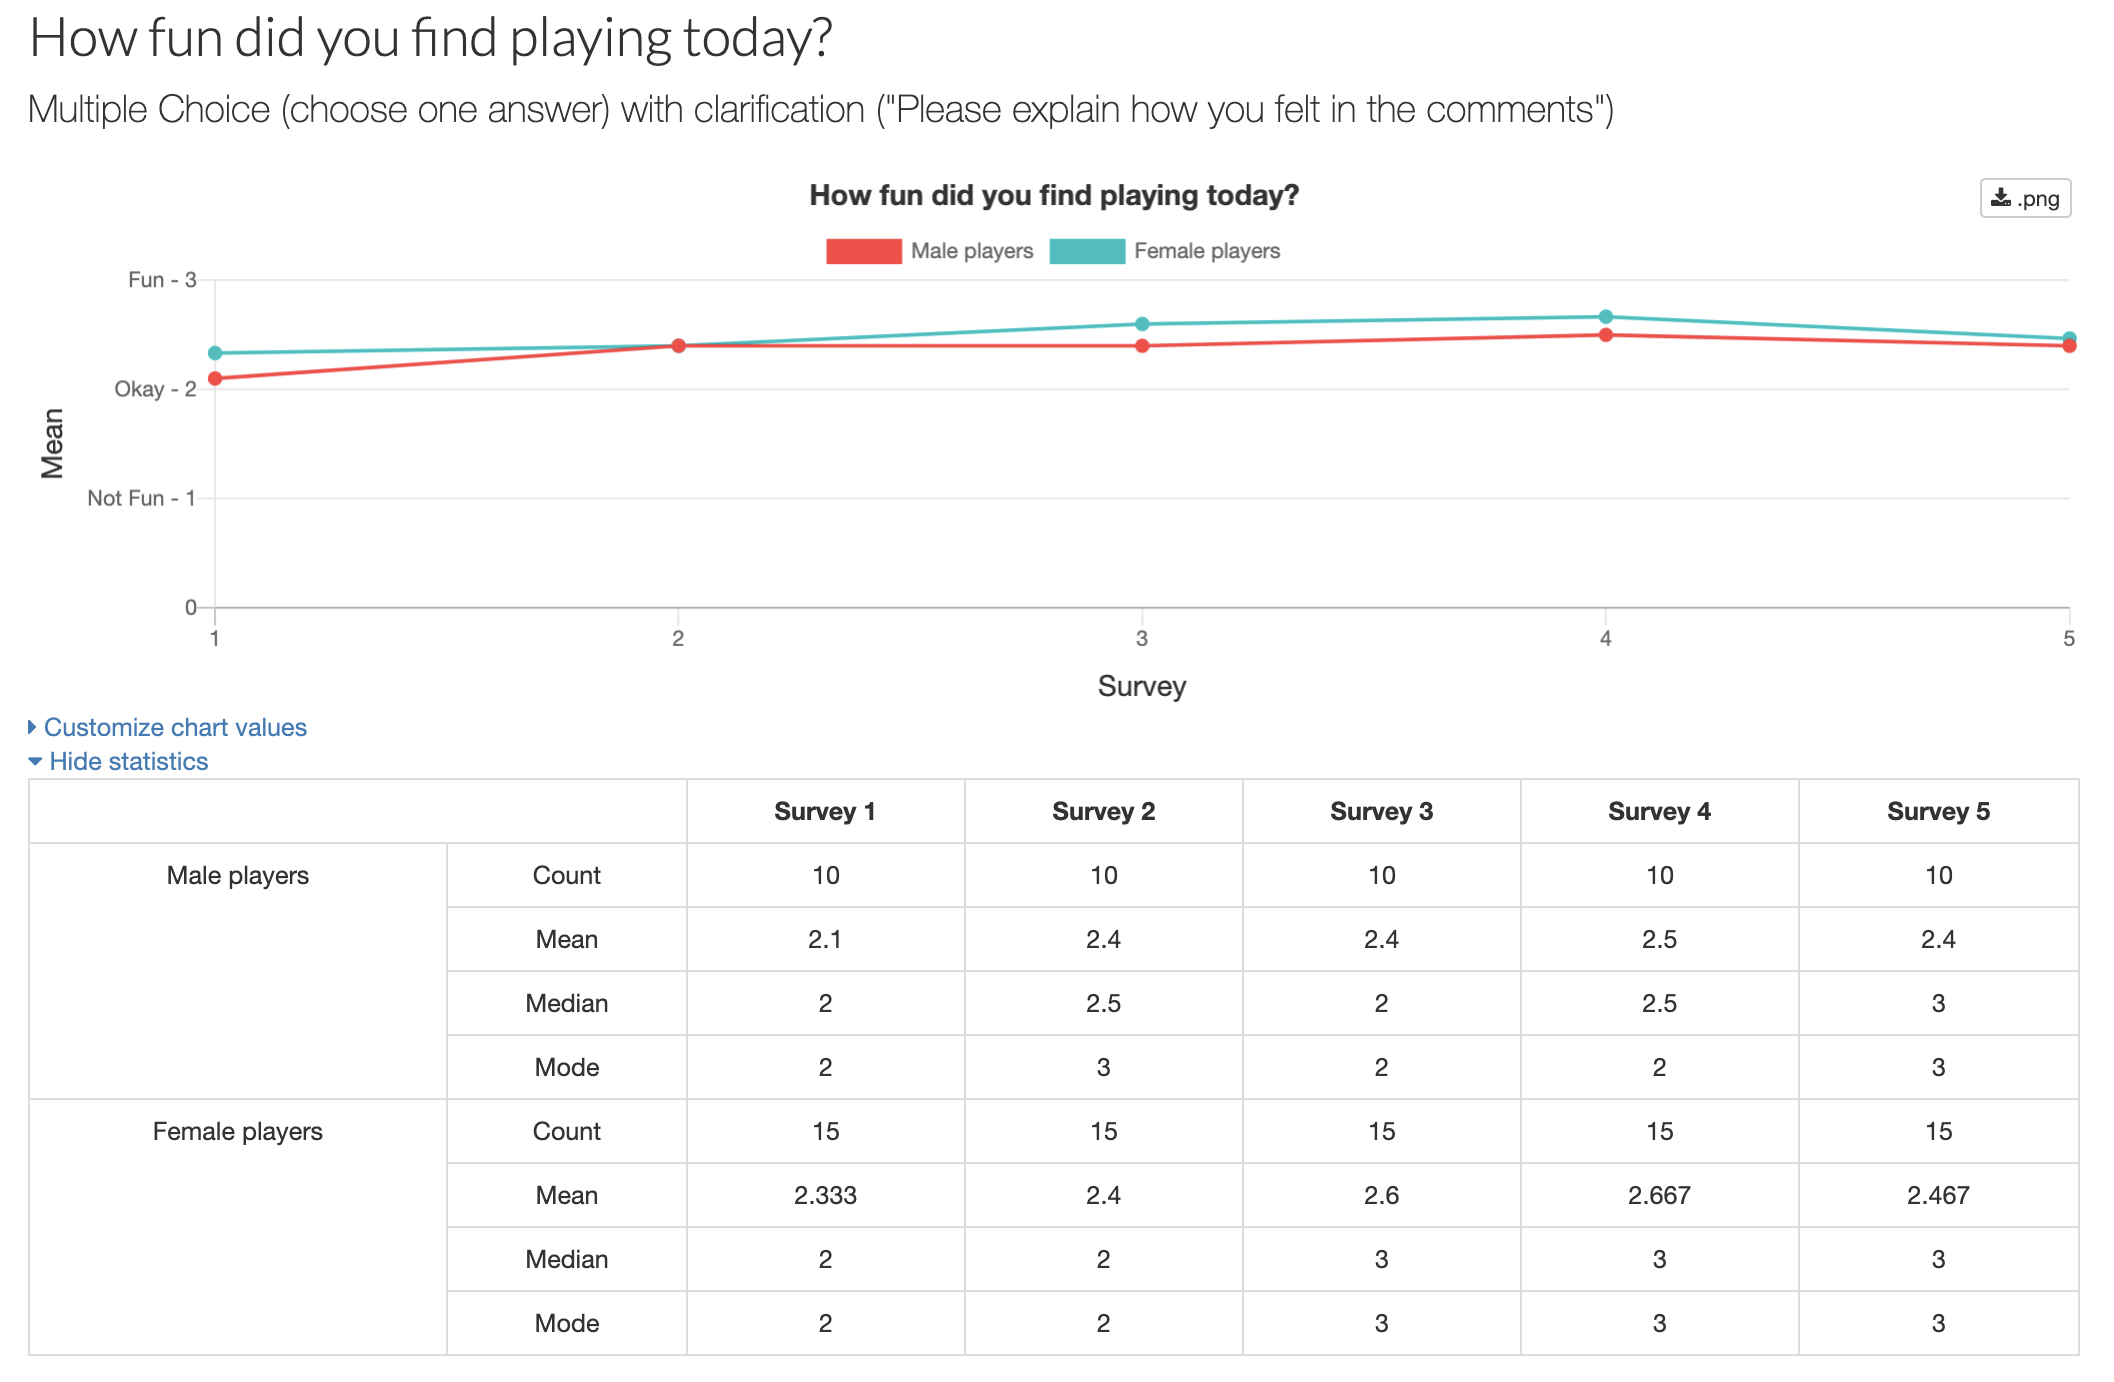
From here you can find a line graph of how your players responded to your survey over the course of your Longitudinal or Multi-session playtest. In this example, we asked the question “How much did you enjoy playing the game today?”. With this view, you can see the results of the survey over time - in order to be able to easily spot a trend.
Additionally, we will let you in on a little inside tip (good things come to those who read the blog posts) if you click on show statistics you will get access to the data that was used to create the graph (such as the mean, median, mode and how many participants took the survey).
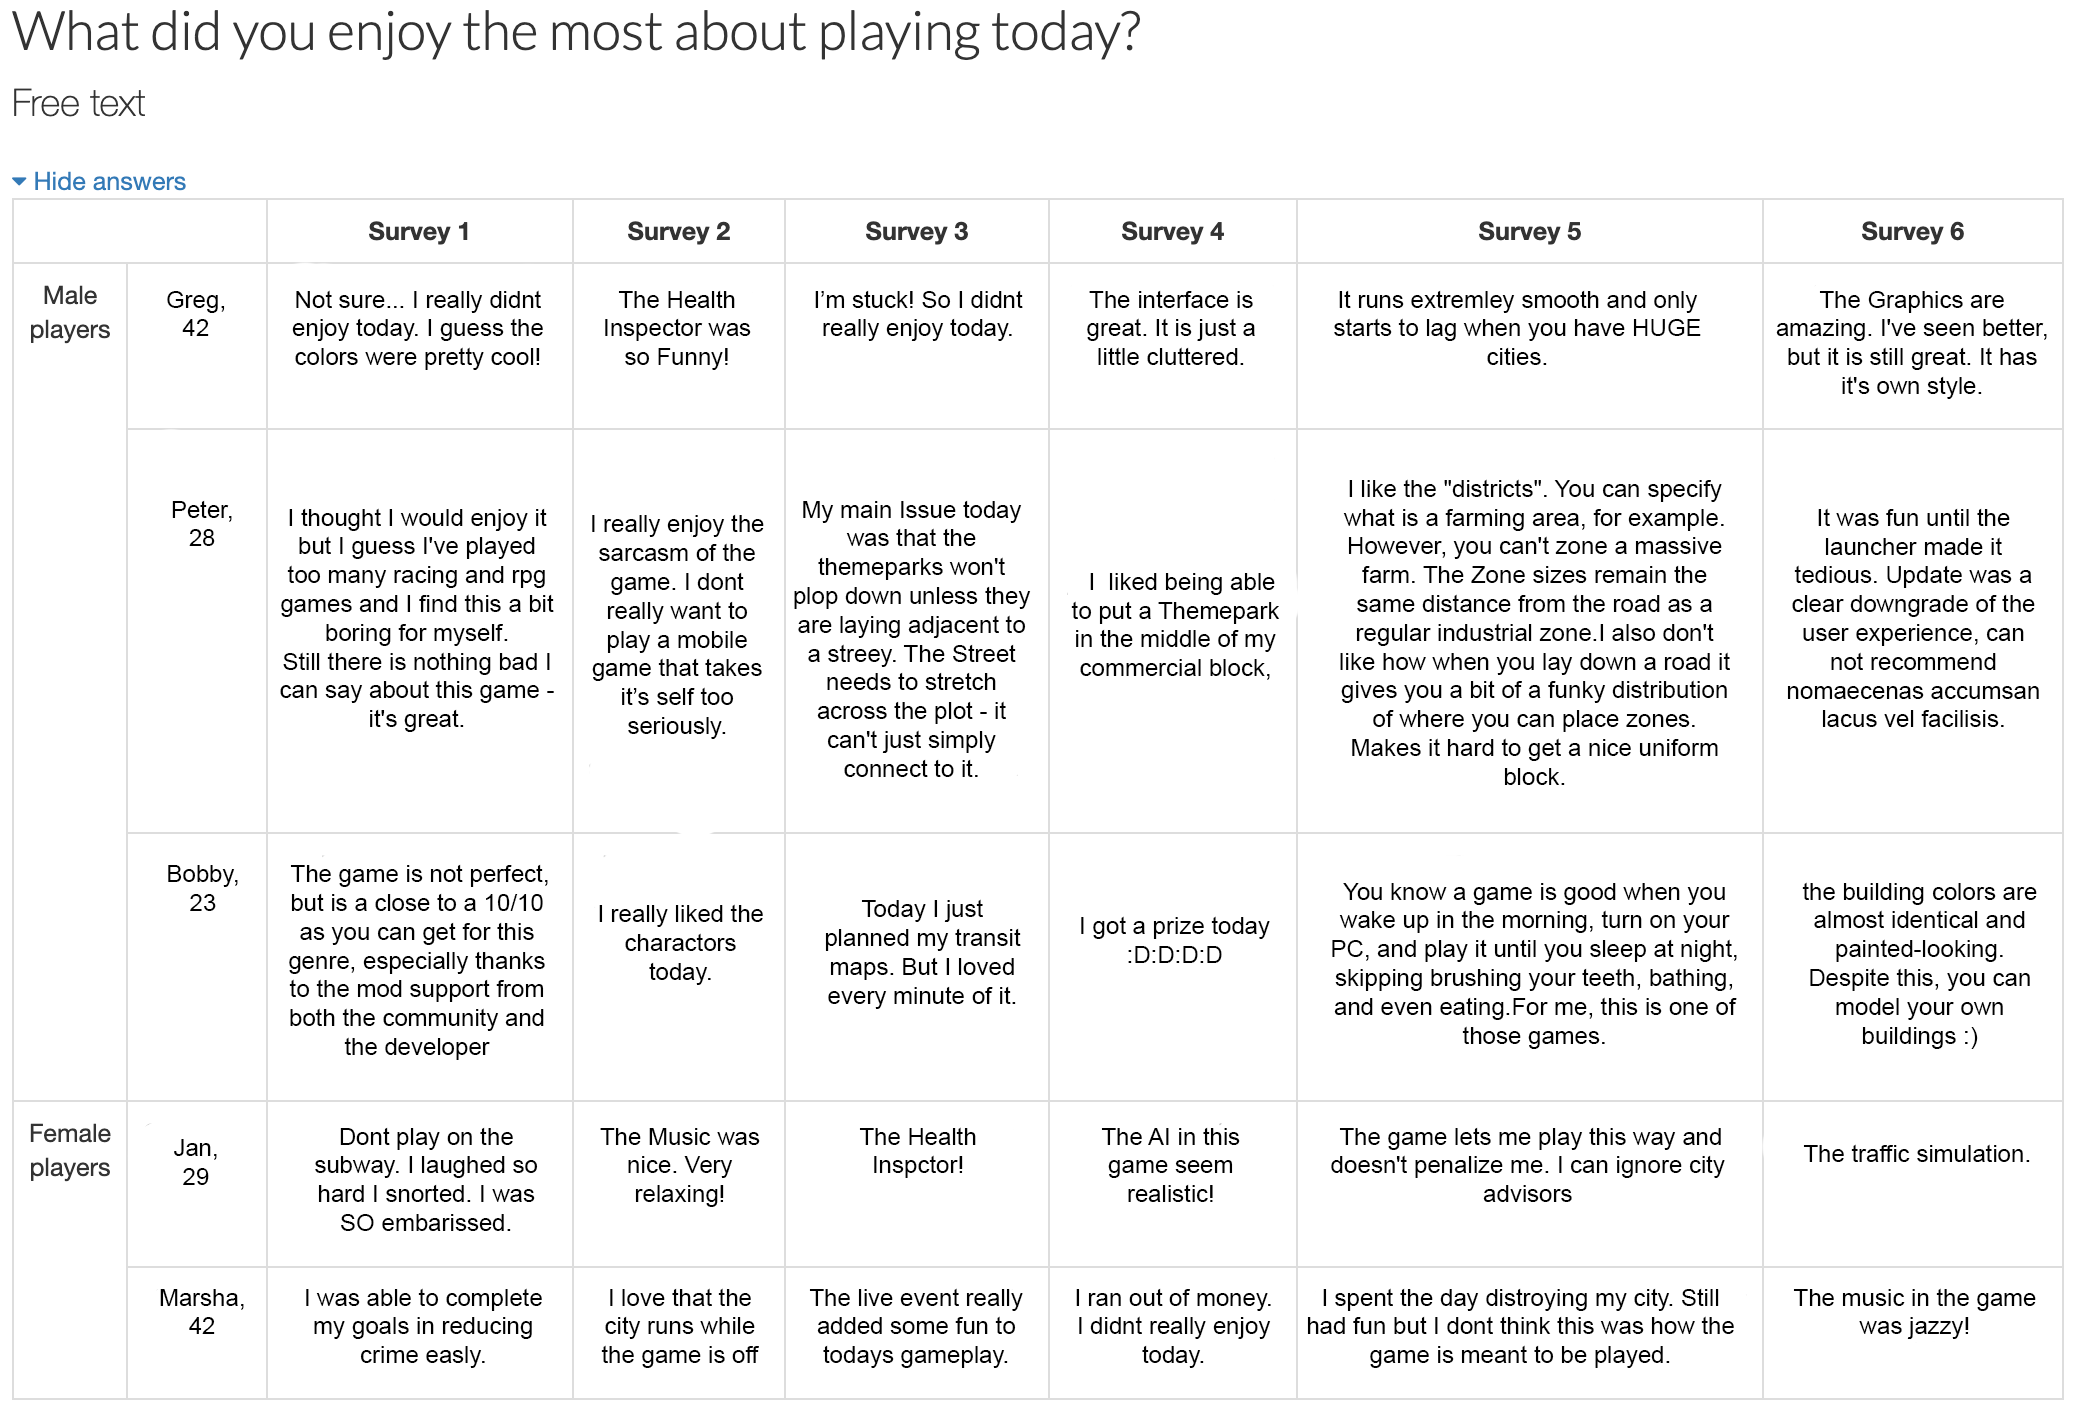
You now also can view the survey answers in one concise chart. We were finding most of our customers were charting out and making tables of the surveys on their own tools. Now, gone are the days of wasting your intern's time, we now automatically compile the data for you.
We hope this update will help you better understand your results from your next Longitudinal or Multi-session playtest. If you have a feature suggestion don’t be afraid to speak up and let us know. And, as always if you have any questions feel free to reach out to us!